Trend trading is is very popular among private traders. In this article you will learn how the basic concept is structured, when trend trading works well and which disadvantages should be considered.
Trend building in trend trading
Trend trading, like many other doctrines, also falls back on the classic approach of a chart technique when defining the trend:
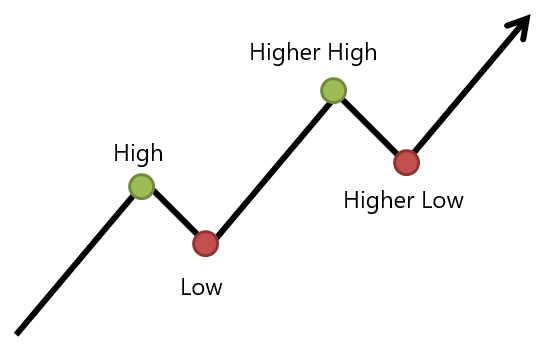
The upward trend is defined by ever-higher highs and ever-higher lows.
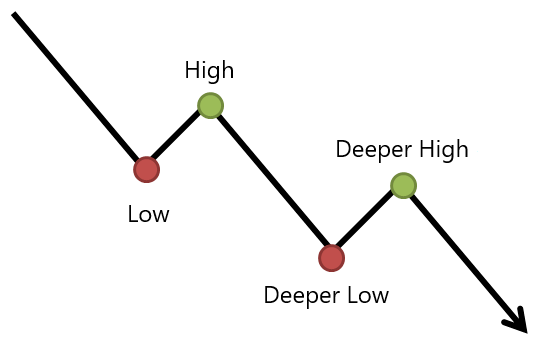
The downward trend is defined by ever-deepening highs and ever-deepening lows.
The 1-2-3 of trend trading
Trend trading is basically not a new concept, but picks up on the Dow Theory of Charles Dow (he created the Dow Jones Index!), who already divided the trend into three phases at the end of the 19th century.
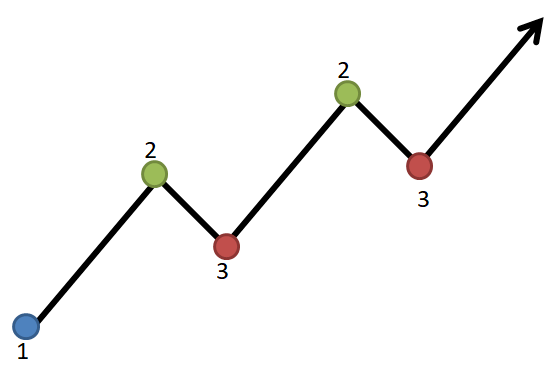
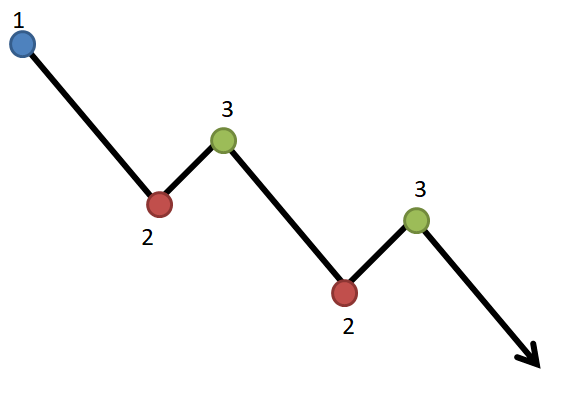
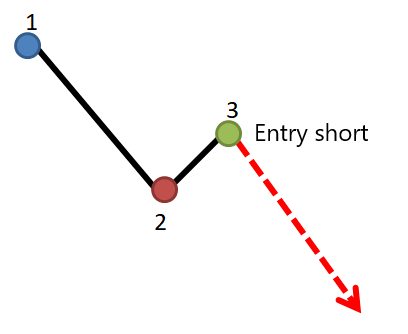
In trend trading, these phases are described with the corresponding highs and lows with the numbers 2 and 3; the starting point with the number 1.
In this article we stick very closely to the explanations of Michael Voigt, who wrote the most popular german book ("Das große Buch der Markttechnik") on this subject.
Points 1-2-3 in the upward trend:
- Starting point
- The following highs
- The following lows
Points 1-2-3 in downward trend:
?
Which trend do I take?
Unfortunately, a trend is not clear-cut. Different phases of ups and downs as well as sideways phases change. Roughly speaking, a trend can be divided into short-term, medium-term or long-term.
The trend trader usually analyses each trend individually. Thus, it is normal for a trader to be short in the short-term downward trend and a medium-term trader to be long in the same market because the medium-term trend is positive.
Advanced trend trader try to combine the different time levels, for example to enter in the short-term upward trend and let the profits run according to the medium or long-term upward trend.
Entries in trend trading
From the trend definition described above with points 2 and 3, two exemplary entry scenarios are presented here.
(Possible variants and detailed explanations can be found in the relevant literature).
Breakthrough at point 2
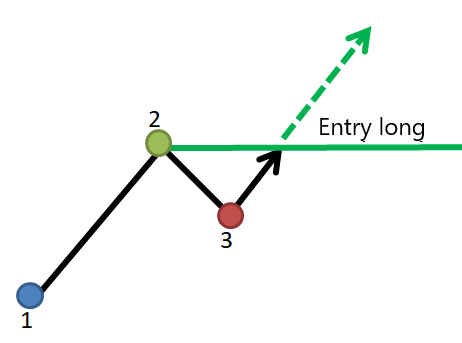
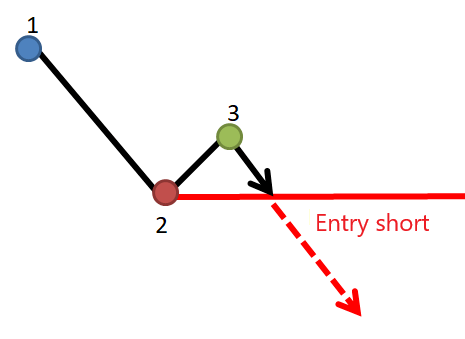
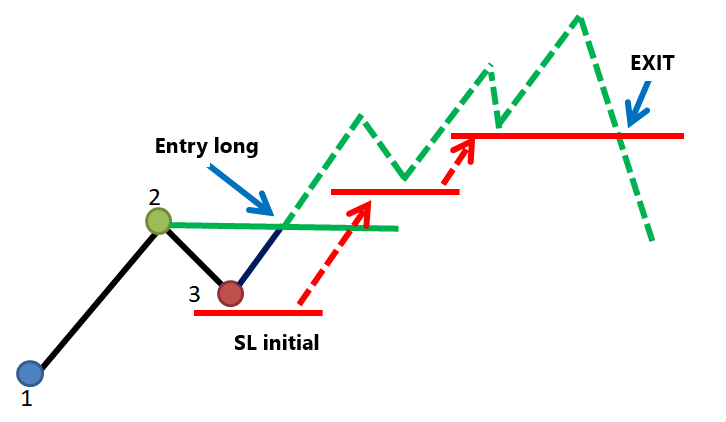
A typical entry setup in trend trading is the break through point 2.
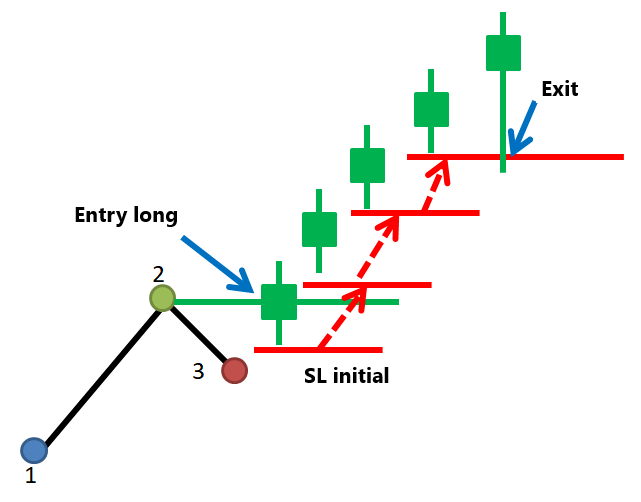
The trend has been identified according to market technical forecasts. The price corrects from point 2 to point 3 and runs back towards point 2 to continue the trend. Now the entry is made when the price level crosses point 2. The position is opened in the direction of the trend:
Entry in the correction
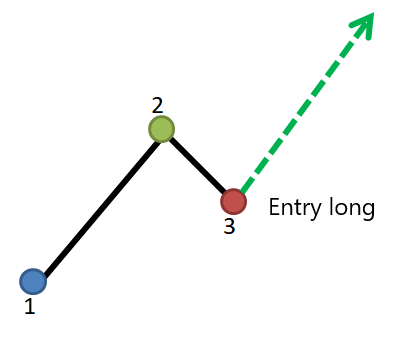
Another typical entry setup in trend trading is trading out of the correction at point 3.
The trend has been identified according to technical market forecasts. The price corrects from point 2 to point 3. Now the entry is made at a possible turning point, which is often an old point 2 or is determined using other tools such as Fibonacci retracements. The position is opened in the direction of the trend:
Exits in trend trading
Here we look at the typical procedure for exiting a trade.
In trend trading, it is typical to exit with a tightened stop loss even in the event of a profit, and less frequently with a previously determined take profit.
Stop loss when trading the trend
The aim of this strategy is to gain as much as possible from a continuation of the trend. To this end, price setbacks are accepted.
The stop loss is initially set behind point 3 and is always tightened to the next possible point 3.
Stop loss when trading the movement
The aim of this technique is to exploit the momentum and give back as little profit as possible if the price should turn.
The stop loss is pulled below the low of the previous candlestick.
